
Custom Salesforce dashboard for tracking revenue
- Company
- Site 9
- Role
- Salesforce Developer
- Goal
- Provide an easy way for sales and management to track projected revenue from within Salesforce
Note: All values in the dashboard below have been replaced with fake data.
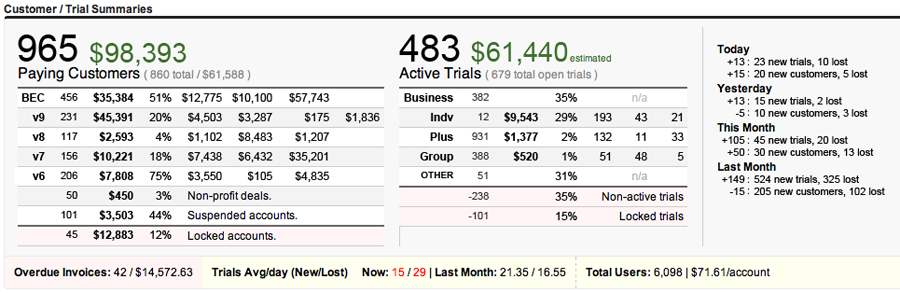
There’s a lot going on with this dashboard.
Over time I kept adding bits of information to provide insight into what was working and what wasn’t. The Paying Cusotmers table is complex because we were experimenting with different pricing models. We allowed customers to stay on whatever pricing they signed up at, so we needed to keep track of the various revisions. We did occasionally force customers off old plans which is why the rows only go back to v6.
The Active Trials table showed the potential new revenue broken down by the plans. We would give extended trials to educational institutions and non-profits, so we had a chunk that were open, but not active.
The right-most table tracked the trend of new trials and new customers. Essentially we always wanted to see positive numbers here. At a glance it was easy to tell how good the day had been.
If I’m remembering right, this table was built using a straight HTML with a bunch of Salesforce queries to get the data. I wanted to add some graphs or pie charts, but that was more effort than it was worth at the time.