<?xml version="1.0" encoding="utf-8"?><feed xmlns="http://www.w3.org/2005/Atom" ><generator uri="https://jekyllrb.com/" version="3.10.0">Jekyll</generator><link href="http://peteruchytil.com/feed.xml" rel="self" type="application/atom+xml" /><link href="http://peteruchytil.com/" rel="alternate" type="text/html" /><updated>2024-09-11T22:30:21+00:00</updated><id>http://peteruchytil.com/feed.xml</id><title type="html">Peter Uchytil</title><subtitle>UX Design Professional - currently looking for work</subtitle><entry><title type="html">Mobile Visualization for Load Options</title><link href="http://peteruchytil.com/Load-Options/" rel="alternate" type="text/html" title="Mobile Visualization for Load Options" /><published>2017-11-09T00:00:00+00:00</published><updated>2017-11-09T00:00:00+00:00</updated><id>http://peteruchytil.com/Load-Options</id><content type="html" xml:base="http://peteruchytil.com/Load-Options/"><![CDATA[<p>A carrier might have a full load one direction but needs a backhaul load so they aren’t running empty. Running empty is avoided at all costs. Usually carriers look for a straight backhaul back to their starting point because it’s the easiest thing to find the way the information is currently presented. It is possible (even probable) that waiting a day, or assembling a series of smaller trips can add up to more profit. The problem becomes, how do we help the users understand these options and compare them to a straight backhaul?</p>

<p><img src="/assets/images/2017-11-09-Load-Options.png" alt="Trip options to maximize profit" /></p>

<p>
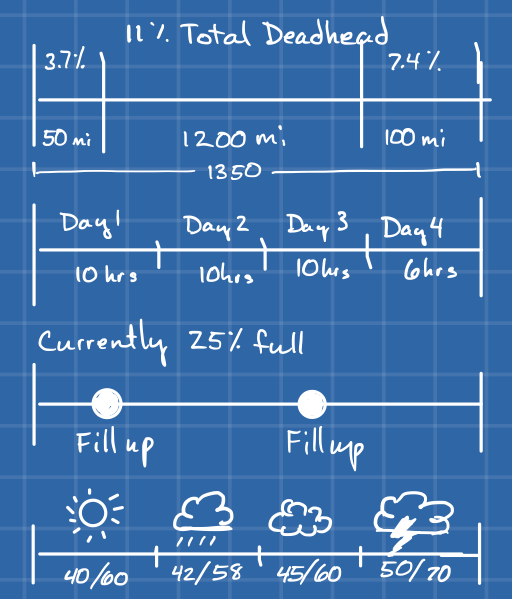
I came up with the above visualization for a multi-stop load search. This would be an alternative to the standard table or list of results. Each option would take up the full screen on mobile. There would need to be other details about the load, the company, etc, but we weren’t concentrating on those at this point.</p>

<p><img src="/assets/images/2017-11-09-Load-Options-close-up.png" alt="Close up on options" /></p>

<p>The top bar, filled in blue, is the first delivery. The squares represent days. Drivers have pretty strict regulations on how long they can drive, so for a single driver, the trip time can be estimated with a high degree of accuracy.</p>

<p>The red outlined bar means the truck has no load, it’s running empty. The small red bars in options 2 and 3 indicate how far the driver has to go to pick up the load (referred to as deadheading).</p>

<p>The lower bars with green are backhaul loads. The green indicates how full the truck would be. Option 4 shows that if the driver can wait a day, a very good load will be available. Option 5 combines two backhaul trips. On the mobile device, the user would swipe to see all the options.</p>

<p>Carriers do a lot of math in their heads while looking at loadboard results. Being off by a little can make a substantial difference. Their tools should do the calculations for them. For example, Option 3 has a higher rate at $4 per mile, but it’s only a 400 mile trip. Option 4’s rate of $3.50 per mile is lower, but the extra 100 miles makes it more profitable.</p>

<p>I don’t know that this visualization is quite there, but something along these lines would help the user understand and compare options better than the big list of results.</p>]]></content><author><name></name></author><category term="portfolio" /><summary type="html"><![CDATA[A carrier might have a full load one direction but needs a backhaul load so they aren't running empty. Usually carriers look for a straight backhaul back to their starting point because it's the easiest thing to find the way the information is currently presented. How do we help the users understand these are options?]]></summary></entry><entry><title type="html">Automatic Layer Naming in Pixelmator Pro</title><link href="http://peteruchytil.com/Pixelmator-Pro/" rel="alternate" type="text/html" title="Automatic Layer Naming in Pixelmator Pro" /><published>2017-11-08T00:00:00+00:00</published><updated>2017-11-08T00:00:00+00:00</updated><id>http://peteruchytil.com/Pixelmator-Pro</id><content type="html" xml:base="http://peteruchytil.com/Pixelmator-Pro/"><![CDATA[<p>I’m writing this entry because I think the auto layer naming feature in Pixelmator Pro is good design, but it may not immediately look impressive.</p>

<p><a href="http://www.pixelmator.com/blog/2017/11/07/11-29/">Pixelmator Pro</a> is coming! I have Adobe shortcuts in my bones, but I like to see what other companies do in the photo and design space. Pixelmator has been a great go-to option for Photoshop users.</p>

<p>In <a href="http://www.pixelmator.com/team/newsletter/">their newsletter</a>, the Pixelmator Team teased an auto layer naming feature. They have a <a href="https://vimeo.com/239633036">video on Vimeo</a> that shows how it works. Drop an image onto the page and Pixelmator Pro will analyze the image and give it a name. In the image below, the hot air ballon image shown at the left was dropped on the page. Cool.</p>

<p><img src="/assets/images/2017-11-08-Pixelmator-Pro.png" alt="Pixelmator Pro - Automatic Layer Naming" /></p>

<p>At first it seems like this is just a nice parlor trick. Something thrown in to get some buzz and capitalize on the whole Machine Learning movement. But this is actually really good design. Sure, the name it gives may not be accurate enough for your needs, or you might want to name it something different because of the structure of your document. You can always find a reason why you wouldn’t use the suggested name. My guess is over time, users will accept those names more often than not. I would say most users don’t even bother to name their layers <em>as they are going</em>. Naming often happens after the fact, if at all.</p>

<p>This feature streamlines the workflow. It removes something the user has to keep track of and think about. Even if the user only keeps the suggested name half the time, that’s still an improvement. This is good, solid designing for usability.</p>]]></content><author><name></name></author><category term="blog" /><summary type="html"><![CDATA[Pixelmator Pro has a new feature that automatically names layers when images are added to a document. While this might seem like a parlor trick kind of feature, I think it's actually an example of really good design.]]></summary></entry><entry><title type="html">Overview of the DAT Loadboard for Truckers Application</title><link href="http://peteruchytil.com/LB4T-Overview/" rel="alternate" type="text/html" title="Overview of the DAT Loadboard for Truckers Application" /><published>2017-11-07T00:00:00+00:00</published><updated>2017-11-07T00:00:00+00:00</updated><id>http://peteruchytil.com/LB4T-Overview</id><content type="html" xml:base="http://peteruchytil.com/LB4T-Overview/"><![CDATA[<p><img src="/assets/images/2017-11-07-LB4T-Overview-thm.png" alt="DAT Loadboard for Truckers App Overview" /></p>

<p>I created this chart in Sketch to help the product owner (and the team) understand the scope of the project. We were in the middle of the project and it was difficult to visualize the work done and the work left to do. The product owner really liked this way of looking at the development.</p>

<p>I view this chart as a success, but also a frustration. It takes a lot of work to build a chart like this and maintain it. There aren’t tools yet that give you this kind of visualization and organization. Ideally I would like something like this:</p>

<p><img src="/assets/images/2017-11-07-LB4T-sketch-1.png" alt="Sketch of organizational tool" /></p>

<p>Each slot in the chart would have details about that screen. This could use a flexible system like Trello to customize what is useful for a given project. The final assets for a given screen would be linked here, along with the versioned history. Perhaps there could even be a snapshot command for the whole structure so the entire project could be rolled back if necessary. I can think of all kinds of features for an application like this.</p>

<p>Ideally you could switch between views. One view might show all screens at the same level to give a sense of the amount of total work. Another view would group the possible states for a screen to get a high level picture of an application.</p>

<p><img src="/assets/images/2017-11-07-LB4T-sketch-2.png" alt="Grouped states for screens" /></p>

<p>A tool like this would be so useful in communicating project scope with management, especially with mobile apps. Mobile often seems simple. We all use mobile apps every day, so we’re very familiar with them. We learn the workflows and forget the complexity. Something like this helps visualize the real development scope. I wish I had time to write this app!</p>]]></content><author><name></name></author><category term="portfolio" /><summary type="html"><![CDATA[It is difficult to communicate the scope of a project. I manually put together this overview of one of DAT's mobile apps to help. What I would really like is a design tool that could do this.]]></summary></entry><entry><title type="html">Balancing Data with Intuition</title><link href="http://peteruchytil.com/Balancing-data/" rel="alternate" type="text/html" title="Balancing Data with Intuition" /><published>2017-10-30T00:00:00+00:00</published><updated>2017-10-30T00:00:00+00:00</updated><id>http://peteruchytil.com/Balancing-data</id><content type="html" xml:base="http://peteruchytil.com/Balancing-data/"><![CDATA[<p><a href="https://medium.com/@jonyablonski/balancing-data-with-intuition-3e8b6657c47f">Balancing Data with Intuition</a> by Jon Yablonski:</p>

<blockquote>
  <p>While data is inherently non-subjective, there are a number of ways it can be manipulated. Firstly, the way user tests are constructed or conducted has the potential to skew the results. Secondly, how we interpret data can be skewed by our own subjective bias. Misinterpreted data can quickly lead to us solving problems that don’t exist or creating new ones unknowingly.</p>
</blockquote>

<p>This is a great, short read by Jon Yablonski. In it, he breaks down when data is useful in design and illustrates potential pitfalls.</p>

<p>My evolution as a designer was through product management and software development, not formal design schooling. I wasn’t exposed to rigorous data collection and research strategies. Early on I didn’t plan for how data could be used to better inform direction. Because I didn’t plan for it, when I did collect data, it was seldom actionable. That didn’t stop people from trying, of course, but as the article says, the data always seemed too open to interpretation.</p>

<p>Recently there have been a lot of articles trying to explain what designers do, especially user experience designers. For me, design has always been the ability to creatively explore solutions while holding the user’s viewpoint in your head. That sounds too simple. How do you <strong>know</strong> when you’ve got it right? Well, you don’t really. You are always making an educated guess.</p>

<p>This is because “why” is hard to measure. “What” can be measured, and measured at scale. Recording click-rates for 100 users is just as easy as 10. The more results, the clearer any possible patterns are to see. Scale helps “what” become visible.</p>

<p>“Why” is not only hard, but trying to answer “why” at scale is almost impossible because every user adds effort. It takes many more resources to evaluate “why” for 100 users than it does 10.  Instead, you have to rely on your intuition.</p>

<p>If you’re not a designer, that is not a satisfying answer. Intuition doesn’t seem clinical enough. Too much possibility for bias. But, designers know there is bias and we are prepared for it. We look for it and challenge each other over it. Evangelists of data collection over intuition often don’t realize the biases introduced just by the collection methods used.</p>

<p>This is not to say that data has no place. Data is just another tool, a piece in the design process. Used intentionally, data helps validate assumptions. Data should be used to guide decisions, not make them. Like Yablonski says, the best approach is to balance data and intuition.</p>]]></content><author><name></name></author><category term="blog" /><summary type="html"><![CDATA[In _Balancing Data with Intuition_, Jon Yablonski breaks down when data is useful in design and illustrates what some of the pitfalls are. This is an excellent, short read. There's a lot being written about data-driven design being superior to user-centric design. Like Yablonski, I'm not so sure.]]></summary></entry><entry><title type="html">Exploring button locations for cards</title><link href="http://peteruchytil.com/Card-UX/" rel="alternate" type="text/html" title="Exploring button locations for cards" /><published>2017-10-27T00:00:00+00:00</published><updated>2017-10-27T00:00:00+00:00</updated><id>http://peteruchytil.com/Card-UX</id><content type="html" xml:base="http://peteruchytil.com/Card-UX/"><![CDATA[<p>This is a simple example of exploring various card layouts. In the desktop applications, we didn’t use the card pattern, so we had to experiment. We used the Material Guidelines as a base.</p>

<p><img src="/assets/images/2017-10-27-card-ux.png" alt="Cards Image" /></p>]]></content><author><name></name></author><category term="portfolio" /><summary type="html"><![CDATA[This is a simple example of exploring various card layouts. In the desktop applications, we didn’t use the card pattern, so we had to experiment. We used the Material Guidelines as a base.]]></summary></entry><entry><title type="html">Custom Salesforce dashboard for tracking revenue</title><link href="http://peteruchytil.com/Salesforce-Dashboard/" rel="alternate" type="text/html" title="Custom Salesforce dashboard for tracking revenue" /><published>2017-10-27T00:00:00+00:00</published><updated>2017-10-27T00:00:00+00:00</updated><id>http://peteruchytil.com/Salesforce-Dashboard</id><content type="html" xml:base="http://peteruchytil.com/Salesforce-Dashboard/"><![CDATA[<p>Note: All values in the dashboard below have been replaced with fake data.</p>

<p><img src="/assets/images/2017-10-27-Salesforce-Dashboard-900.png" alt="Salesforce Dashboard" /></p>

<p>There’s a lot going on with this dashboard.</p>

<p>Over time I kept adding bits of information to provide insight into what was working and what wasn’t. The <strong>Paying Cusotmers</strong> table is complex because we were experimenting with different pricing models. We allowed customers to stay on whatever pricing they signed up at, so we needed to keep track of the various revisions. We did occasionally force customers off old plans which is why the rows only go back to v6.</p>

<p>The <strong>Active Trials</strong> table showed the potential new revenue broken down by the plans. We would give extended trials to educational institutions and non-profits, so we had a chunk that were open, but not active.</p>

<p>The right-most table tracked the trend of new trials and new customers. Essentially we always wanted to see positive numbers here. At a glance it was easy to tell how good the day had been.</p>

<p>If I’m remembering right, this table was built using a straight HTML with a bunch of Salesforce queries to get the data. I wanted to add some graphs or pie charts, but that was more effort than it was worth at the time.</p>]]></content><author><name></name></author><category term="portfolio" /><summary type="html"><![CDATA[ProtoShare.com is a SaaS application with self-sign up. Sign-ups come with a free trial period. The customer funnel was custom built around Salesforce and this dashboard provided a way for management to understand current and future revenue.]]></summary></entry><entry><title type="html">How to order and label inbox-like items</title><link href="http://peteruchytil.com/Worklist/" rel="alternate" type="text/html" title="How to order and label inbox-like items" /><published>2017-10-26T00:00:00+00:00</published><updated>2017-10-26T00:00:00+00:00</updated><id>http://peteruchytil.com/Worklist</id><content type="html" xml:base="http://peteruchytil.com/Worklist/"><![CDATA[<p>In the mobile freight matching application, it was harder to keep track of specific loads due to the screen space limitations. We wanted to give users a to which users could save loads. There are many reasons users might want to save loads, but they boil down to two main workflows: 1) want to build a call list and 2) I booked a load and I want to save the information. We didn’t have the time to build a system that would allow users to differentiate the reason they were saving a load so we explored ways to help users keep track of things.</p>

<p><img src="/assets/images/2017-10-26-Worklist.png" alt="Worklist date options" /></p>

<p>The area where loads were saved to was called the Worklist. The assumption was loads that were added today belonged to a call list. Everything else would be historical, probably loads that had been booked and were being saved.</p>

<p>The option that I think worked the best was labeling items added during the current day with “Added: TODAY” and everything else gets a month/day label. The other options seemed to have more cognitive load, or had information that wasn’t helpful. For instance, showing the time added for items added today makes them visually different and easy to pick out, but then the user is parsing the time. At this point, the time has no relevance. Anything to call on today is equally important.</p>

<p>We ended up preferring a layout that moved from a table of items to individual items broken into cards. The cards were organized according to creation date. We wanted to add status tagging as well.</p>

<p><img src="/assets/images/2017-10-26-Final-Worklist.png" alt="Worklist Final desired design" /></p>]]></content><author><name></name></author><category term="portfolio" /><summary type="html"><![CDATA[Experimenting with labeling options for loads saved to a worklist for later action. Tricky because there were two main reasons to save a load to a worklist.]]></summary></entry><entry><title type="html">Comparison of Detail Layouts</title><link href="http://peteruchytil.com/Comparison-of-Detail-Layouts/" rel="alternate" type="text/html" title="Comparison of Detail Layouts" /><published>2017-10-24T00:00:00+00:00</published><updated>2017-10-24T00:00:00+00:00</updated><id>http://peteruchytil.com/Comparison-of-Detail-Layouts</id><content type="html" xml:base="http://peteruchytil.com/Comparison-of-Detail-Layouts/"><![CDATA[<h1 id="comparison-of-detail-layouts">Comparison of Detail Layouts</h1>

<p><img src="/assets/images/2017-10-24-detail-comparison.jpg" alt="Detail Comparison" /></p>

<p>This is a wireframe for the DAT Trucker mobile app. As always with DAT apps, the struggle is to get the information density as high as possible, but still being readable. In this case, the denser layout on the right felt really good. Everyone liked it, but when tested for scan-ability, it fared worse than the straight list.</p>

<p>This was a close one because a lot of people really preferred the layout on the right. The scanning tests showed the layout on the left was better for scanning, but was it that much better? We expected users to interact with this screen a lot, so would they just learn the positions of items? Probably, but the items listed change for each detail page. Not all items apply to ally locations. Number of gas pumps doesn’t matter for a place that doesn’t sell gas. Also, the layout on the right works as long as lines don’t wrap. Part of what makes the layout pleasing is the symmetry of the rows. Because the user can change the text size and new items can be added to by the backend database, we couldn’t guarantee lines would never wrap. At least on the left we had more room to play with. Having items in each section listed in alphabetical order made it predictable on how to find any given item in a section.</p>

<p>If the data had been different, we may have gone with the layout on the right, but ultimately we decided the layout on the left was the most usable and flexible.</p>]]></content><author><name></name></author><category term="portfolio" /><summary type="html"><![CDATA[The DAT Trucker app includes a number of points of interest for truck drivers. In an update to the app, we wanted to improve the layout of the details page.]]></summary></entry><entry><title type="html">Get Me Home concept design</title><link href="http://peteruchytil.com/Get-Me-Home/" rel="alternate" type="text/html" title="Get Me Home concept design" /><published>2017-10-24T00:00:00+00:00</published><updated>2017-10-24T00:00:00+00:00</updated><id>http://peteruchytil.com/Get-Me-Home</id><content type="html" xml:base="http://peteruchytil.com/Get-Me-Home/"><![CDATA[<p><img src="/assets/images/2017-10-24-get-me-home.png" alt="Get Me Home" /></p>

<p>A driver typically commits to a one leg of a trip at a time. If a load from Portland is to be delivered to Chicago, the driver won’t look for a return load until they get close to Chicago. The market changes quickly enough that the best loads usually get taken the same day they are posted. It is not uncommon for a driver to take a load going somewhere they haven’t been. In the mobile app we wanted a simple way for a driver to do a search from wherever they currently are to home. Just like the “navigate me home” feature of any GPS app.</p>

<p>This was a situation where the concept was well understood and we casually talked about it in the early phases of the project. When we got closer to the time to build it, we realized it wasn’t quite as simple. Doing a search from the user’s location using the GPS on their phone was simple enough, but there’s little details that are needed to do a proper search. The most important of which, where is home? After that, we need to know the parameters of the truck: what type is it, how long is it, how much weight can it handle? We could probably deduce these values from previous searches, but what if this is the first search the user does in the app? We knew we would need a screen to collect this information.</p>

<p>The button for the screen on the left would normally ay “Get Me Home”, but it would start out as “Set up Get Me Home” until the user enters the necessary values. The hamburger menu would contain a link to change these values once they are set.</p>

<p>The feature contained to be more complicated than we anticipated. There are many ways to prioritize a search: shortest distance, highest profit, and home by a certain date. We didn’t start exploring these options in the initial product release. We did briefly think about a pattern like a regular tap would run the search, sorting the results by the user’s default, but a tap and hold would bring up an option menu to customize the sort.</p>]]></content><author><name></name></author><category term="portfolio" /><summary type="html"><![CDATA[The concept of "Get Me Home" is straightforward, but the implementation continued to raise interesting quirks.]]></summary></entry><entry><title type="html">Concept for “Trip Help” for load searches</title><link href="http://peteruchytil.com/trip-help/" rel="alternate" type="text/html" title="Concept for “Trip Help” for load searches" /><published>2017-10-24T00:00:00+00:00</published><updated>2017-10-24T00:00:00+00:00</updated><id>http://peteruchytil.com/trip-help</id><content type="html" xml:base="http://peteruchytil.com/trip-help/"><![CDATA[<p>DAT’s freight matching network only has a minimal amount of information. This keeps the network fast and scalable. The theory is the carriers know their business well, so they don’t need extra help in determining what loads are a best fit for them. This was an exercise to say, what <em>could</em> we give carriers that would help make a better decision.</p>

<p>This example is shown for a tablet, but it would work the same on a desktop. When I sketch, I sometimes switch to this blueprint background. I find it puts me in a slightly different headspace which can be useful.</p>

<p><img src="/assets/images/2017-10-17-trip-help.png" alt="Trip Help" title="The Trip Help section contains information that is pertinent to the user when evaluating a load." /></p>
<h4>The Trip Help concept for a tablet. </h4>

<p>The Trip Help section would be a set of panes that would scroll left/right. Here’s a breakdown of the sections.</p>

<div id="examples">
	<img src="/assets/images/2017-10-17-trip-help-callout-1.png" />
	<p>
This section details the capacity of the user’s truck and how much of it this load will use. Some carriers routinely put multiple loads for different customers in their trucks. This can be highly profitable, but the logistics are challenging.</p>

	<img src="/assets/images/2017-10-17-trip-help-callout-2.png" />
	<p>
Driving is becoming more and more regulated. Drivers are only allowed to be on the road so long and then they have mandatory down time. Even experienced drivers can under estimate the time required for a trip. People are often overly optimistic when measuring time. This section is meant to help the driver understand the total time the trip will take by including their hours-of-service requirements and the estimated refueling stops. The weather helps the driver know to expect slowdowns due to slick roads or other congestion. The deadhead chart at the top isn’t completely necessary, but it helps the driver understand the percentage of the trip that is overhead.
</p>

<img src="/assets/images/2017-10-17-trip-help-callout-3.png" />
<p>
Drivers often deal with dozens of companies. It might be helpful to remind them of the companies they have dealt with before. This includes loads they have done and their personal rating vs. everyone’s rating. Since the trucking industry is all about relationships, any rating/notes kind of measurement is good to have as “for this user” and “for everyone” as any given user’s experience may be very different than the larger public’s. </p>

<img src="/assets/images/2017-10-17-trip-help-callout-4.png" />
<p>
DAT has products to measure the average rate per lane. We can use that to compare the poster’s offer rate to the lane average. This is another area where users are so familiar with the data that they can miss things. Most of the time they are probably fine doing the math in their head, but that opens the possibility to misreading something. Doing the calculation for them doesn’t hurt anyway.</p>

<img src="/assets/images/2017-10-17-trip-help-callout-5.png" />
<p>
Drivers will keep mental or paper notes about carriers. This works fine for companies they deal with a lot, but even for those, why make the user remember something? Showing notes on a company here it keeps everything in context. Overall the goal is to reduce the number of places a user has to look for information to make a decision. Loads move quickly. 
</p>
</div>]]></content><author><name></name></author><category term="portfolio" /><summary type="html"><![CDATA[Booking loads is all about negotiation. As a carrier you want as much information as you can get to make an informed decision. In the current environment, the useful information is scattered. It would be helpful to consolidate and present data in a way that is quickly consumable to allow for better negotiations.]]></summary></entry></feed>