
Concept for "Trip Help" for load searches
- Company
- DAT Solutions
- Role
- Lead UX Designer
- Goal
- Improve the information available to carriers doing load searches
DAT’s freight matching network only has a minimal amount of information. This keeps the network fast and scalable. The theory is the carriers know their business well, so they don’t need extra help in determining what loads are a best fit for them. This was an exercise to say, what could we give carriers that would help make a better decision.
This example is shown for a tablet, but it would work the same on a desktop. When I sketch, I sometimes switch to this blueprint background. I find it puts me in a slightly different headspace which can be useful.

The Trip Help concept for a tablet.
The Trip Help section would be a set of panes that would scroll left/right. Here’s a breakdown of the sections.
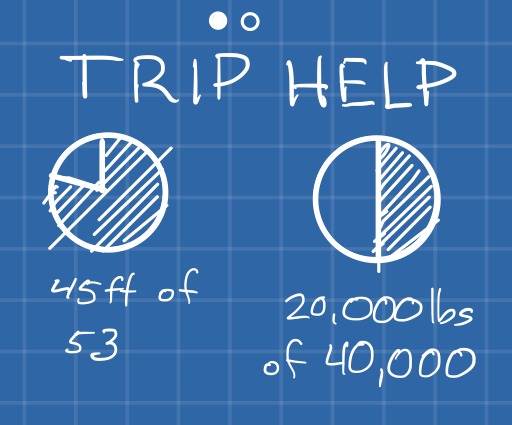
This section details the capacity of the user’s truck and how much of it this load will use. Some carriers routinely put multiple loads for different customers in their trucks. This can be highly profitable, but the logistics are challenging.
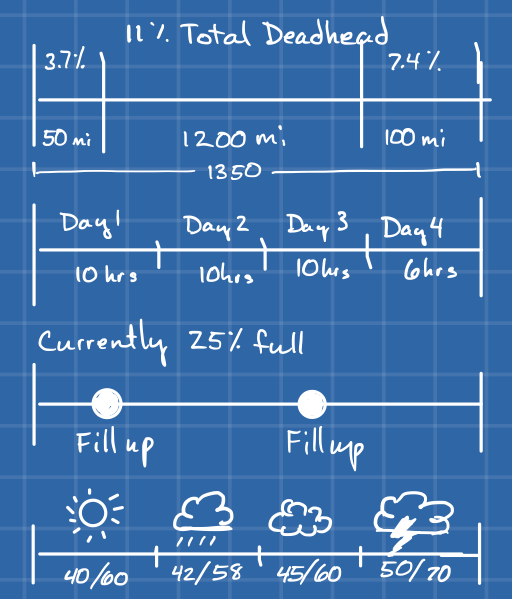
Driving is becoming more and more regulated. Drivers are only allowed to be on the road so long and then they have mandatory down time. Even experienced drivers can under estimate the time required for a trip. People are often overly optimistic when measuring time. This section is meant to help the driver understand the total time the trip will take by including their hours-of-service requirements and the estimated refueling stops. The weather helps the driver know to expect slowdowns due to slick roads or other congestion. The deadhead chart at the top isn’t completely necessary, but it helps the driver understand the percentage of the trip that is overhead.
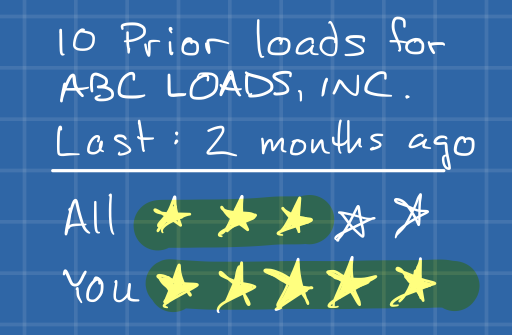
Drivers often deal with dozens of companies. It might be helpful to remind them of the companies they have dealt with before. This includes loads they have done and their personal rating vs. everyone’s rating. Since the trucking industry is all about relationships, any rating/notes kind of measurement is good to have as “for this user” and “for everyone” as any given user’s experience may be very different than the larger public’s.
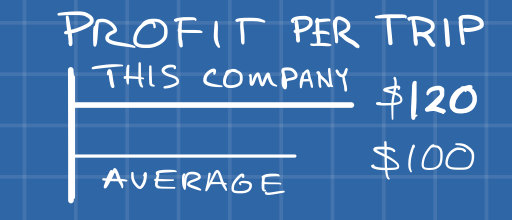
DAT has products to measure the average rate per lane. We can use that to compare the poster’s offer rate to the lane average. This is another area where users are so familiar with the data that they can miss things. Most of the time they are probably fine doing the math in their head, but that opens the possibility to misreading something. Doing the calculation for them doesn’t hurt anyway.

Drivers will keep mental or paper notes about carriers. This works fine for companies they deal with a lot, but even for those, why make the user remember something? Showing notes on a company here it keeps everything in context. Overall the goal is to reduce the number of places a user has to look for information to make a decision. Loads move quickly.